Our Insights

Category: Data Engineering

data analytics consulting
It seems we can’t find what you’re looking for.
Analytics

Helping Illumina Become More Data Driven

CIO of illumina, Norm Fjeldheim has said, “Analytica’s team has done a great job setting up and supporting our Tableau environment and developer community here at illumina.” Find out what we did to gain his approval.

Read More »
Analytics

California Department of Public Health Launches Public-Facing Dashboards

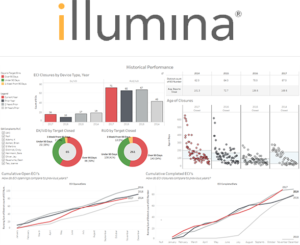
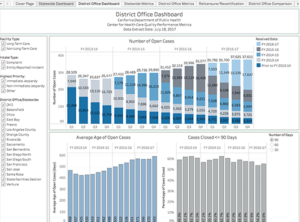
Congratulations to the California Department of Public Health for releasing publicly-available interactive data visualizations!  As one of the first State Agencies to provide public data via interactive dashboards, they are setting the pace for transforming static reports into dynamic, user-friendly tools. By utilizing these tools, CDPH is providing the public with a way to connect with publicly available data like never before, while encouraging them to ask questions, explore data, and make their own unique data discoveries. To view the dashboards, click here. For more information on how your organization can utilize data visualizations to connect users with data, please email us at [email protected].

Read More »
Visualization

Los Angeles Real Estate Visualization

Brent Johnson, Senior Consultant at Analytica Consulting created the dashboard below for visualizing the real estate market in Los Angeles. The dashboard breaks the market down by property type and the decade of construction. It also shows a detailed map of Los Angeles properties with a street view of each selected home. The tool is highly useful for anyone looking for a specific number of bedrooms or bathrooms, a desired zip code and cost. If you have any questions or would like more information regarding this visualization tool, contact Brent at: [email protected].

Read More »