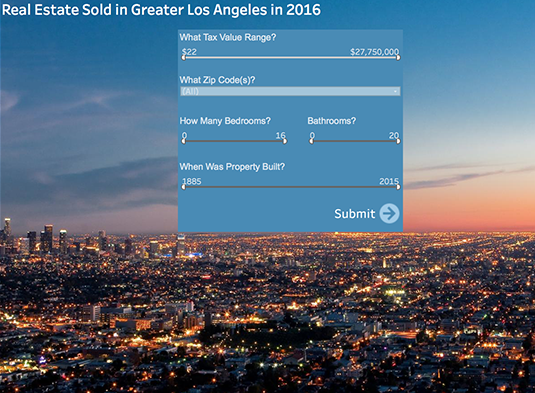
Brent Johnson, Senior Consultant at Analytica Consulting created the dashboard below for visualizing the real estate market in Los Angeles. The dashboard breaks the market down by property type and the decade of construction. It also shows a detailed map of Los Angeles properties with a street view of each selected home. The tool is highly useful for anyone looking for a specific number of bedrooms or bathrooms, a desired zip code and cost. If you have any questions or would like more information regarding this visualization tool, contact Brent at: brentjohnson@analyticaconsulting.com.