Our Insights

Category: Data Governance

data analytics consulting
It seems we can’t find what you’re looking for.
Analytics

Creating a Denodo Data Virtualization Layer for Illumina Quality

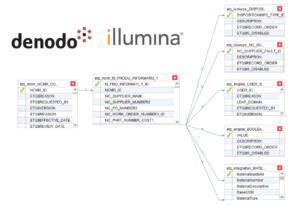
San Diego headquartered biotech company, Illumina, tasked Analytica with creating a Denodo data virtualization layer to support the data access needs for the Quality department. Why is this important? Now engineers, analysts, and other quality data users have access to real-time quality data including up-to-date non-conformances, corrective actions, complaints, audits, and more. Learn more about the Illumina Quality project we completed!

Read More »
News

State of CA Tableau Users Group (CalTUG) Summer Meeting

The State of California Tableau Users Group (CalTUG) Summer Meeting in Sacramento took place on August 27th and brought in over 280 people from multiple California state departments and several private companies. Jake Coniglione, Senior Consultant at Analytica, was one of the three presenters at the event. He covered data flow automation for Tableau dashboards, and demonstrated examples from projects at CDPH’s Emergency Preparedness Office.

Read More »
Analytics

Case Study: CDPH State Enforcement Actions Dashboard Revamped by Analytica Consulting

The California Department of Public Health (CDPH), through the Center for Health Care Quality (CHCQ), is responsible for ensuring that more than 10,000  health facilities comply with state or federal laws or regulations. For some state regulatory violations, CDPH may issue a citation or an administrative penalty with monetary consequences. These actions vary by facility type. CDPH State Enforcement Actions (SEA) provides public dashboards with up-to-date data on these violations. Analytica was tasked with converting a static internal dashboard into an automated public-facing data visualization that was friendly to both technical and non-technical users. This involved not only a complete redesign of the existing dashboard, but also modernizing the data architecture that feeds the dashboard.  This is what we did: Improved the aesthetics, functionality, and overall user-experience. Added filters so that both the public and CDPH staff can find exactly what they are looking for without needing multiple resources. Implemented

Read More »
Analytics

U.S. States Producing the Most Wind Energy Dashboard

Jake Coniglione, Senior Consultant at Analytica Consulting, is an environmentalist who is passionate about renewable energy. Having grown up in California watching wind turbines improve and multiply over the years, he became very interested in this form of renewable energy. This dashboard shows which U.S. states currently produce the most wind energy, and shows how little wind energy is currently captured in the U.S. relative to the potential of this resource. View the interactive dashboard here.

Read More »
Analytics

California Department of Public Health Launches a Wildfire Emergency Dashboard

In November 2018, the deadly Camp Fire and Woolsey Hill Fires impacted both Northern and Southern California simultaneously. To better understand how the fires affected health facilities across the state, Analytica partnered with the California Health and Human Services Agency and various government departments (CDPH, OSHPD, DHCS, DSS) to build an interactive version of the daily status report to be disseminated to stakeholders across the state each day during the incidents. The resulting dashboards reported both operational and evacuation status of facilities near the fire perimeter using key performance dashboards and interactive maps. Future incidents will use this template for reporting, allowing end users to gain daily updates and drill-down information regarding impacted facilities during an emergency. Additionally, users will see a historical record with the ability to perform deeper analysis on how emergencies affect impacted communities.

Read More »